Structure of the evaluation report
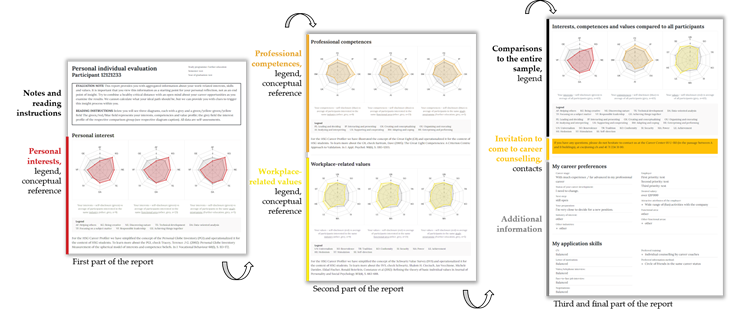
The evaluation sheet is divided into seven passages. First you will find notes and a reading guide.
Below this, you will find the aggregated illustration of your interests (green), competencies (blue) and values (red). In each of these three blocks you will find three spider web diagrams in which your profile is compared to the average profile of the comparison group. The first comparison group is the group of participants who are interested in the same industry; the second comparison group is interested in the same functional area and the third comparison group is studying in the same type of degree program.
The fourth block again compares interests, competencies and values of the total sample at your university in spider web diagrams.
Under the blocks with the spider's web diagrams you will find the contact channels to the Career Services at your university.
In the seventh and final block you will find raw data on your preferences for career development and application skills.
Interpreting the evaluation report correctly
The core elements of the evaluation report are the spider web diagrams, in which your interest, competence, and value profiles are presented and compared to the group comparisons.
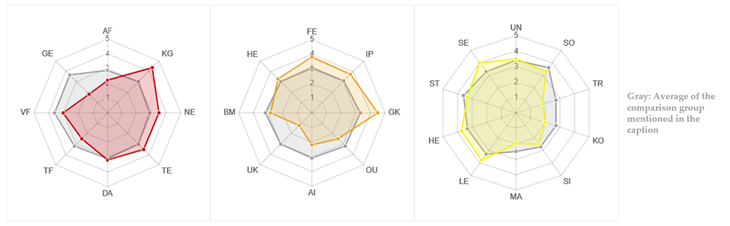
Your information is the basis for the respective coloured (green, blue, red) diagram. The mean values of the comparison group are shown behind your graph and in grey. The scale represents a continuous dimension from 1 to 5 according to the 5-point scale used during data collection.
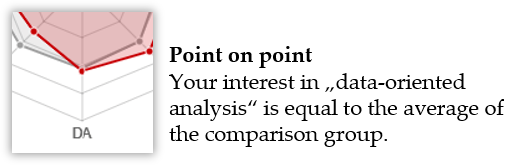
If, for a factor, one corner of your coloured diagram lies exactly on the corner of the diagram of the comparison group, then your values lie exactly in the mean value of the comparison group.
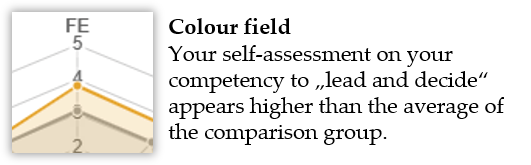
If, for one factor, one corner of your coloured diagram is higher on the scale than the corner of the comparison group chart, your values are higher than the mean value of the comparison group. In this case the difference is shown as a coloured area.
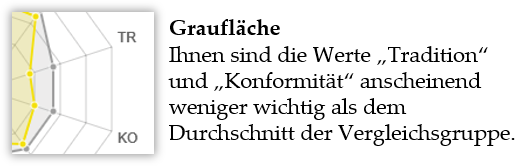
If, for a factor, one corner of your coloured diagram is lower on the scale than the corner of the comparison group chart, your values are lower than the mean value of the comparison group. In this case the difference is shown as a grey area.
Typical profile shapes
There are countless different profile shapes - none is better or worse, right or wrong. However, there are also some profile forms that occur more frequently and should therefore be discussed briefly:
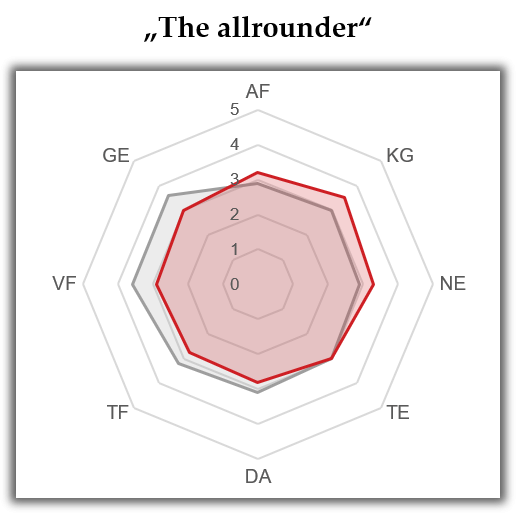
"The all-rounder" - a profile form in which (almost) all factors are very close to the value 3. The profile appears very balanced. Everything interests a little. Advantages of this profile are that it is very open and flexible. A challenge can be that clear decisions for or against a direction or option can feel difficult.
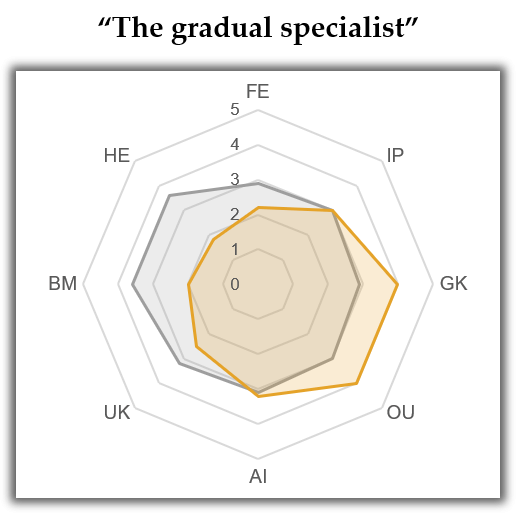
"The gradual specialist" - a profile shape where a more or less balanced circular shape appears parallel-shifted in one direction. Although the profile appears balanced, it also shows a clear and characteristic centre of gravity in the direction of the shift. Here a focus of interest has obviously formed (while other topics are of much less interest), one field of competence is clearly stronger than others or a clear preference for certain values (and turning away from opposing values) becomes apparent. The advantages of this profile are that it indicates clear preferences, decisions can be made more easily and the differentiation from competitors is also clear. A challenge may be that a perceived focus may narrow the horizon in an unacceptable way ("I can't lead well!" - although it has never been seriously tried).
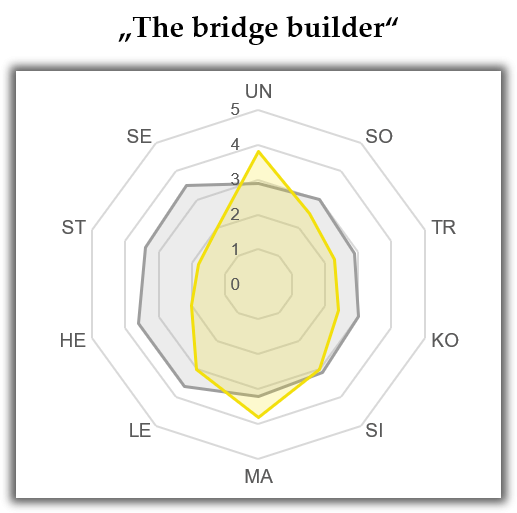
"The bridge builder" - a profile form in which opposite factors show particularly high or particularly low values. The profile seems to want to connect two opposite poles - the other values, however, are low. Example: simultaneous preference for sociality and performance ("I want to work in a performance-oriented company where the employees are friendly and forgiving towards each other"). The advantages of this profile are that it is less common and possibly a unique selling point. A challenge may be that the two opposing factors may not be easily reconciled. The integration of the two factors may require a greater transfer capacity, a longer search, or it may cause more stress.